
Stop Reporting Data. Start Reporting Business Growth.
Marketing teams often spend hours creating reports packed with clicks, impressions, and engagement metrics. Yet many CEOs glance at these reports for a few seconds before moving on. Why? Because they are looking for business outcomes, not marketing jargon.
A well-designed marketing dashboard bridges this gap. Instead of overwhelming executives with data, it presents the metrics that directly influence revenue, profitability, customer growth, and strategic decision-making.
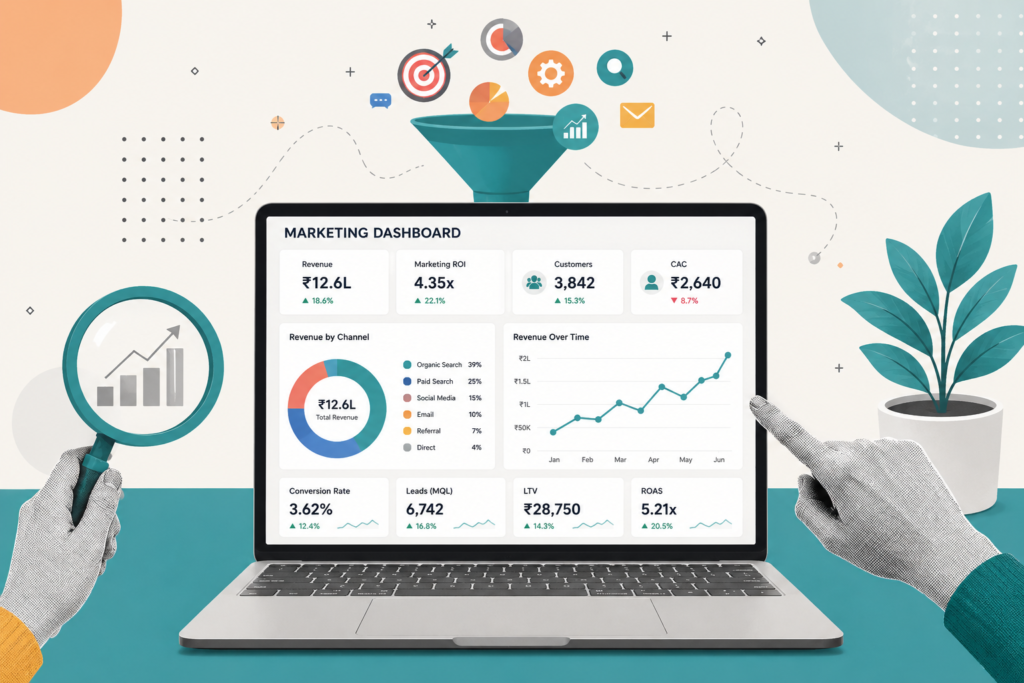
If you’re responsible for reporting marketing performance, this guide will show you how to build a marketing dashboard that executives actually find useful. You’ll also learn how to create an effective executive marketing dashboard, choose the right KPIs, and leverage tools like a GA4 marketing dashboard and Looker Studio dashboard to deliver actionable insights.
Why Most Marketing Dashboards Fail
After working with analytics platforms and reporting tools, one common challenge becomes clear: marketers often report what is easiest to measure instead of what executives actually need.
A typical CEO marketing report may include:
- Sessions
- Click-through rate
- Bounce rate
- Social media likes
- Keyword rankings
While these are valuable marketing metrics, they rarely answer the CEO’s biggest questions:
- Is marketing driving revenue?
- Which channels generate the highest ROI?
- Are we acquiring profitable customers?
- Should we increase next month’s marketing budget?
An effective marketing reporting dashboard shifts the conversation from activity to business impact.
The Essential Metrics Every CEO Wants
A successful marketing dashboard should focus on business performance rather than vanity metrics. These KPIs help leadership understand whether marketing is contributing to sustainable growth.
1. Revenue by Channel
Instead of simply tracking traffic sources, focus on showing how much revenue each marketing channel generates.
Use Google Analytics 4 to measure:
- Organic Search
- Paid Search
- Social Media
- Referral
- Direct Traffic
Including revenue by channel immediately makes your marketing KPI dashboard more valuable for executive decision-making.
2. Marketing ROI
Every CEO wants to understand whether marketing investments generate returns.
Track:
- Return on investment (ROI)
- Marketing ROI
- Return on ad spend (ROAS)
These metrics help justify future budgets and demonstrate the financial contribution of marketing initiatives.
3. Customer Acquisition Cost (CAC)
An effective executive marketing dashboard should clearly display customer acquisition cost (CAC).
This metric answers:
How much does it cost to acquire one customer?
When combined with campaign performance, CAC becomes one of the strongest indicators of marketing efficiency.
4. Customer Lifetime Value (LTV)
Marketing success isn’t just about acquiring customers.
It’s about acquiring profitable customers.
Showing customer lifetime value (LTV) alongside CAC helps executives evaluate long-term profitability instead of short-term wins.
5. Conversion Rate
Your GA4 marketing dashboard should include:
- Website conversion rate
- Lead conversion rate
- Sales conversion rate
A healthy conversion rate often tells a stronger business story than raw traffic numbers.
6. Lead Generation Metrics
Every marketing KPI dashboard should track qualified leads.
Useful lead generation metrics include:
- Marketing Qualified Leads (MQLs)
- Sales Qualified Leads (SQLs)
- Cost per Lead
- Lead-to-Customer Rate
These indicators connect marketing performance with business growth.
Build a Dashboard That Executives Trust
A high-performing marketing dashboard isn’t built by adding more charts. It’s built by presenting the right information in the right order.
Start with an Executive Summary
Every CEO marketing report should begin with a concise executive summary.
Include:
- Revenue generated
- Overall marketing ROI
- Best-performing channel
- Biggest opportunity
- Recommended next action
This gives executives immediate context without requiring them to interpret complex reports.
Use KPI Scorecards
Instead of showing dozens of charts, create a KPI scorecard highlighting:
- Revenue
- Leads
- Conversion Rate
- CAC
- LTV
- ROI
Simple scorecards improve executive reporting and make dashboards easier to understand.
Visualize Trends
Good dashboard visualization helps executives identify trends instantly.
Examples include:
- Revenue growth
- Monthly lead trends
- Campaign performance
- Pipeline growth
- Channel comparison
A clean performance dashboard supports faster, data-driven decisions.
Use Looker Studio
A professional Looker Studio dashboard is one of the best ways to centralize marketing reporting.
It integrates with:
- Google Analytics 4
- Google Search Console
- Google Ads
- YouTube
- Search Ads 360
- BigQuery
A connected marketing analytics dashboard reduces manual reporting while improving accuracy.
Build Reports That Inspire Confidence
Executives rely on reports to make important business decisions. Your marketing dashboard must therefore be accurate, transparent, and easy to verify.
Use Reliable Data Sources
Connect your dashboard directly to:
- Google Analytics 4
- Google Search Console
- CRM platforms
- Advertising platforms
Automated data reduces reporting errors and increases confidence in the numbers.
Track Attribution Properly
Without proper attribution reporting, marketing performance becomes misleading.
Your dashboard should clearly show:
- First-touch attribution
- Last-touch attribution
- Multi-touch attribution
Understanding revenue attribution helps executives identify which marketing activities actually influence sales.
Monitor Channel Performance
A complete marketing reporting dashboard should compare channel performance across every acquisition source.
Include:
- Organic Search
- Paid Search
- Social Media
- Email Marketing
- Referral Traffic
Tracking these traffic sources helps identify where marketing budgets deliver the strongest returns.
Build Monthly Reporting Habits
Consistency builds trust.
Create a recurring monthly marketing report containing:
- KPI comparisons
- Revenue trends
- Campaign summaries
- Budget utilization
- Key recommendations
Over time, executives begin relying on these reports as strategic planning tools.
A Simple Marketing Dashboard Template
If you’re building your first marketing dashboard template, organize it into five sections.
Executive Overview
- Revenue
- Marketing ROI
- CAC
- LTV
- Overall Performance
Acquisition
- Traffic Sources
- Organic Search
- Paid Search
- New Users
Conversion
- Conversion Rate
- Lead Generation Metrics
- Cost per Acquisition (CPA)
Revenue
- Revenue by Channel
- Pipeline Reporting
- Revenue Attribution
Performance
- Campaign Results
- Dashboard Visualization
- Stakeholder Reporting
- Business Growth Metrics
This structure creates an intuitive business dashboard that executives can review in minutes.
Dashboard Best Practices
Whether you’re building a GA4 marketing dashboard or a Looker Studio dashboard, follow these dashboard best practices:
- Keep charts simple.
- Limit the number of KPIs.
- Highlight trends instead of raw data.
- Focus on business outcomes.
- Use consistent colors and formatting.
- Include clear annotations for major changes.
- Update data automatically.
- Create a real-time dashboard where possible.
- Prioritize decision-making metrics over vanity metrics.
Remember, dashboards are communication tools—not data dumps.
Common Mistakes to Avoid
Many marketers unintentionally reduce the effectiveness of their marketing dashboard by:
- Reporting too many metrics
- Ignoring financial KPIs
- Failing to connect marketing with revenue
- Using inconsistent reporting periods
- Overcomplicating dashboard layouts
- Skipping stakeholder reporting
- Neglecting marketing performance reports
Avoiding these mistakes leads to more meaningful executive conversations.
Final Thoughts
An outstanding marketing dashboard does far more than display numbers—it tells a business story. By combining meaningful marketing metrics, strong KPI reporting, accurate conversion tracking, and insightful marketing reporting, you help executives make faster and better decisions.
Whether you’re using a marketing dashboard template, building a GA4 marketing dashboard, or designing a Looker Studio dashboard, your goal should always be the same: connect marketing performance with measurable business outcomes.
When your dashboard highlights revenue, profitability, customer growth, and strategic insights instead of vanity metrics, your CEO is far more likely to read it—and act on it.
About the Author
Sourajit Das is a digital marketer passionate about SEO, analytics, AI search, and data-driven marketing strategies. Through Sourajit Das digital marketing, he shares practical guides that help businesses improve reporting, optimize digital performance, and make smarter marketing decisions. Explore more insights and resources at sourajitdas.com.
Sources:
Google Analytics 4 Help, Looker Studio Help Center, Google Search Console Help,Looker Studio Report Gallery